

Tracking your LinkedIn campaigns
The Campaigns screen is the control center of your LinkedIn prospecting: there you track the performance of all campaigns and, for each one, open a full report with leads, activity, performance, the agent that is running and the search filters.
Before you start
- Have a LinkedIn account connected to the platform — see the Connecting Channels tutorial;
- To see data in the reports, you need at least one campaign created — see LinkedIn campaign types.
The campaigns screen
When you open Campaigns, you see the list of all your campaigns. At the top, the Filter by buttons narrow down the list: All, In Review, Active, Paused and Completed — each one already showing how many campaigns it has.
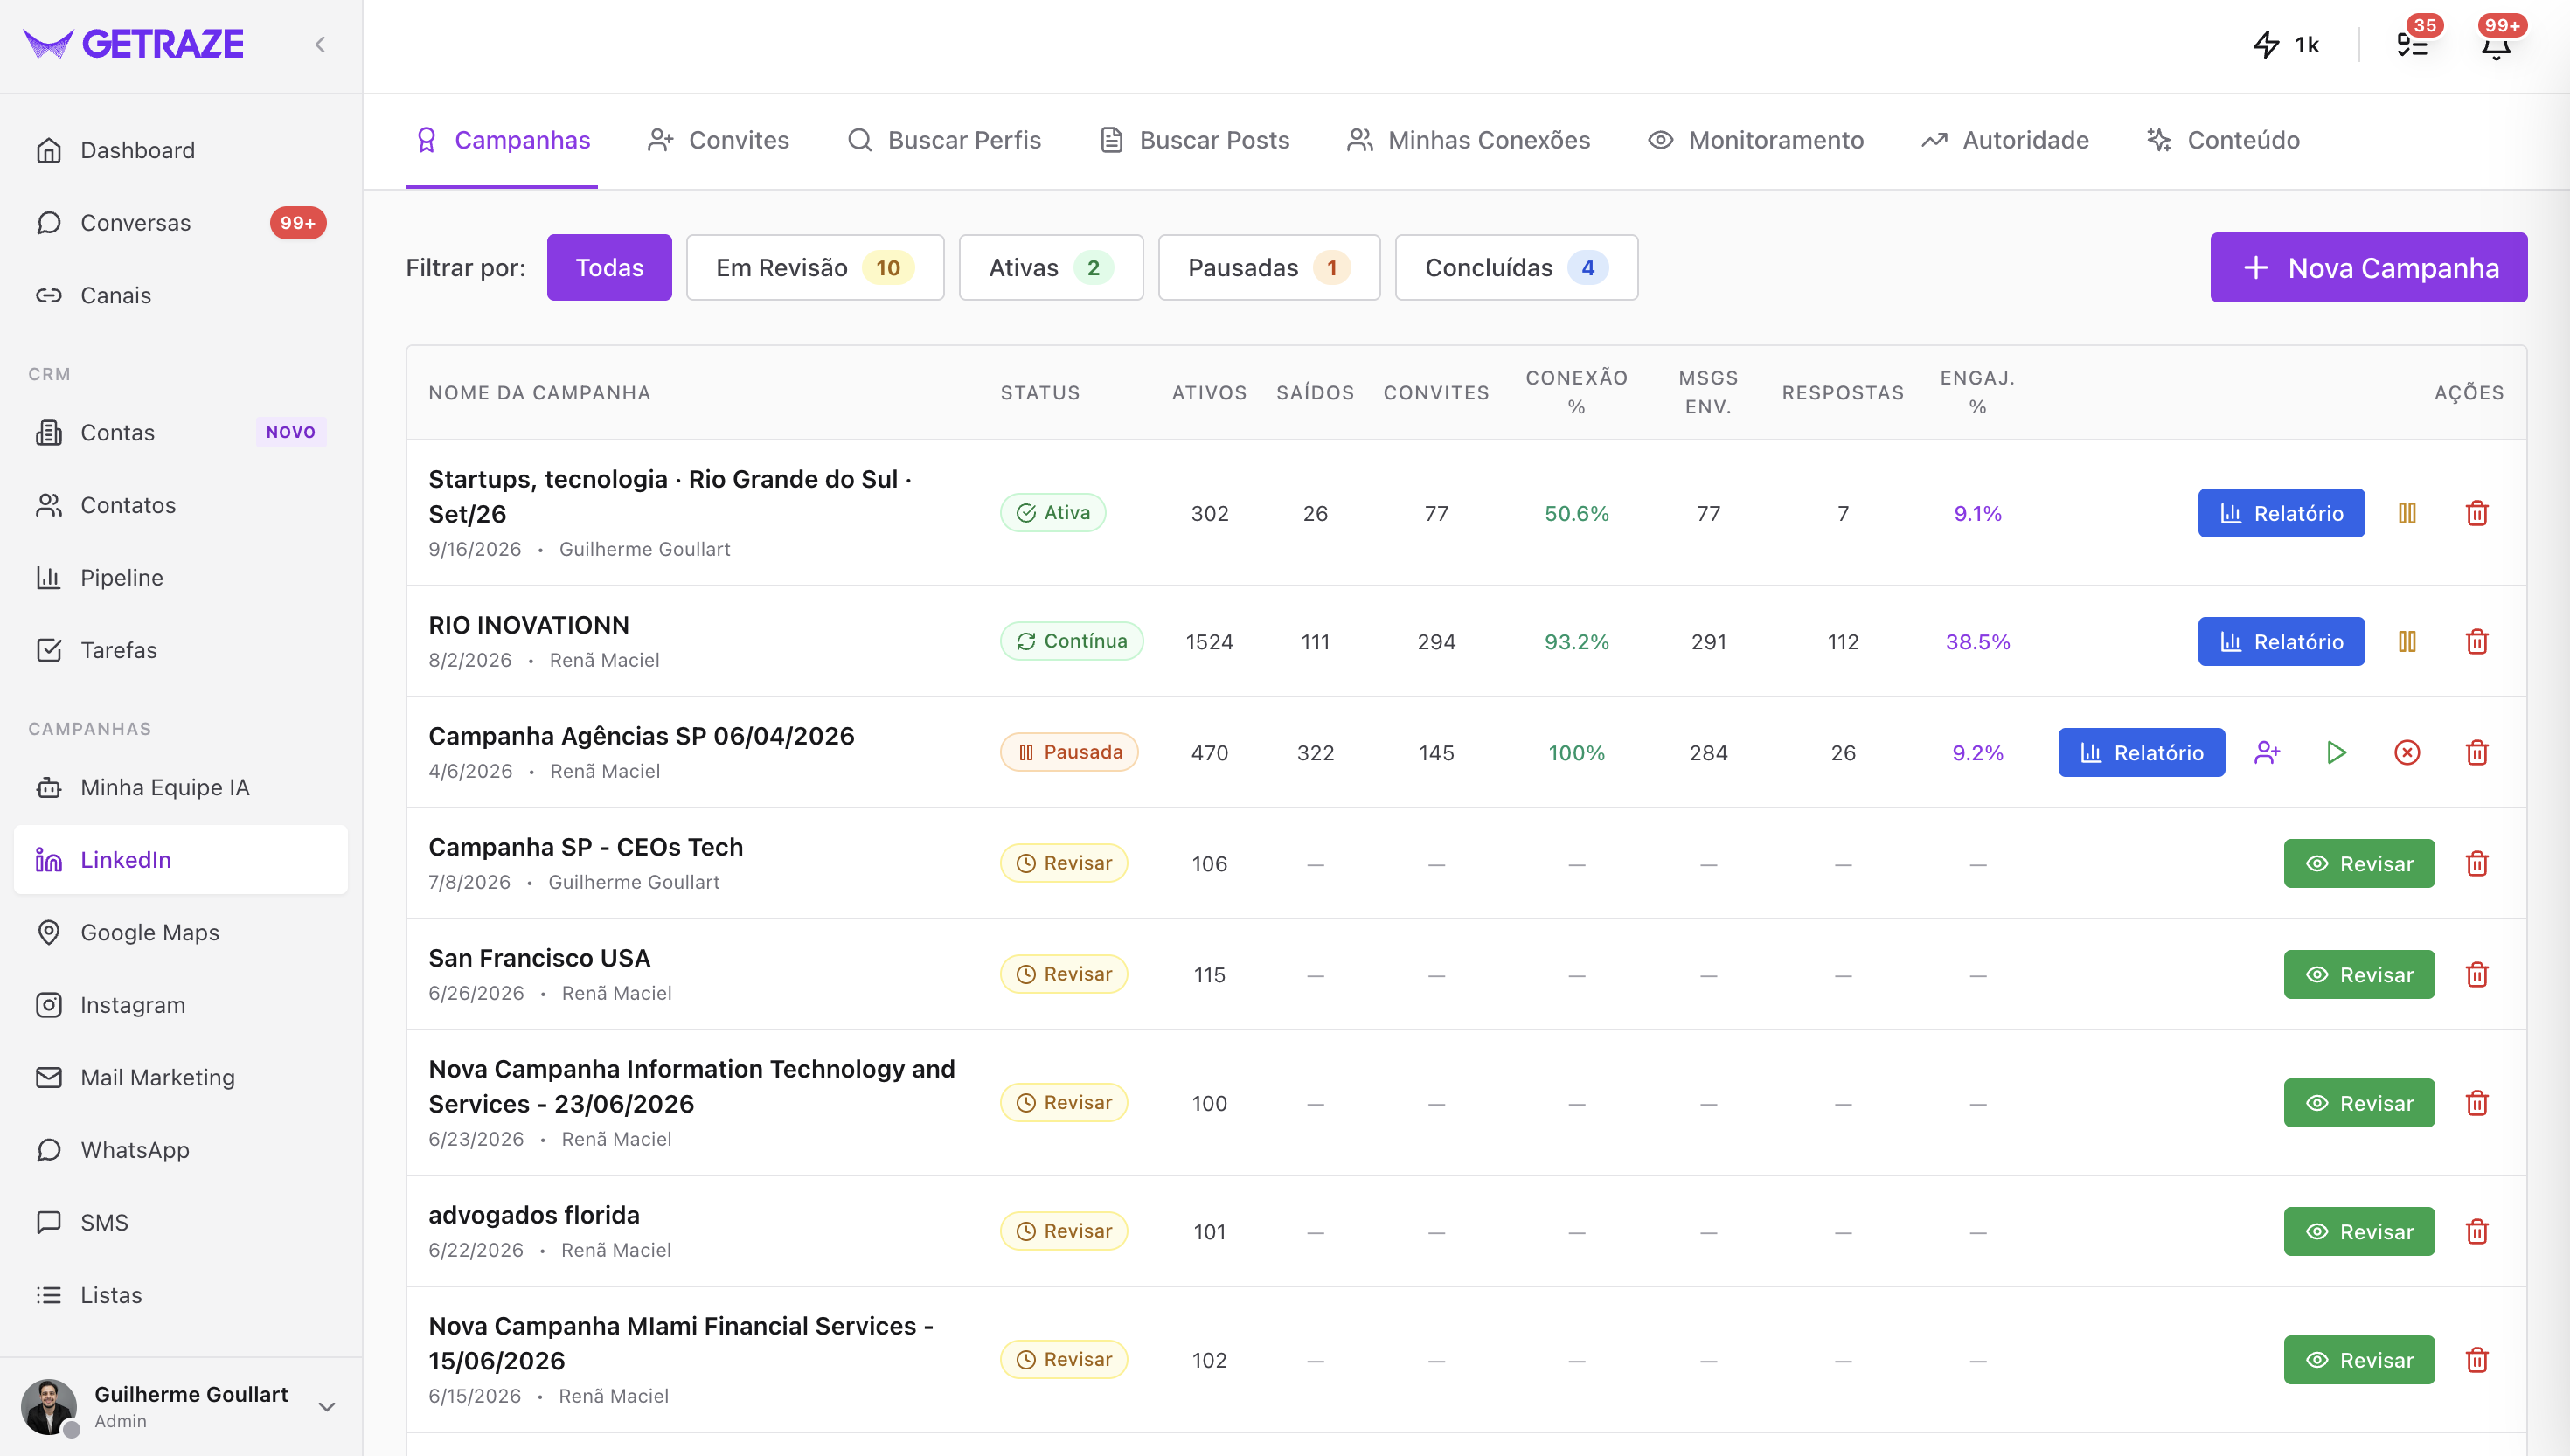
Each row shows the campaign name, with the creation date and the owner right below, and the indicators:
| Column | What it shows |
|---|---|
| Status | Active, Continuous, Paused, Review (waiting for your review) or completed |
| Active | Leads still in progress in the campaign |
| Exited | Leads that have already left the flow |
| Invites | How many connection invites were sent |
| Conn. % | Percentage of invites that turned into connections |
| Msgs Sent | Number of messages sent |
| Responses | How many leads replied |
| Engag. % | Engagement rate on the messages sent |
In the Actions column, the Report button opens the full report. The other actions change according to the status — pause or resume a running campaign, Review when the collection has finished and the campaign is waiting for approval, and delete.
The campaign report
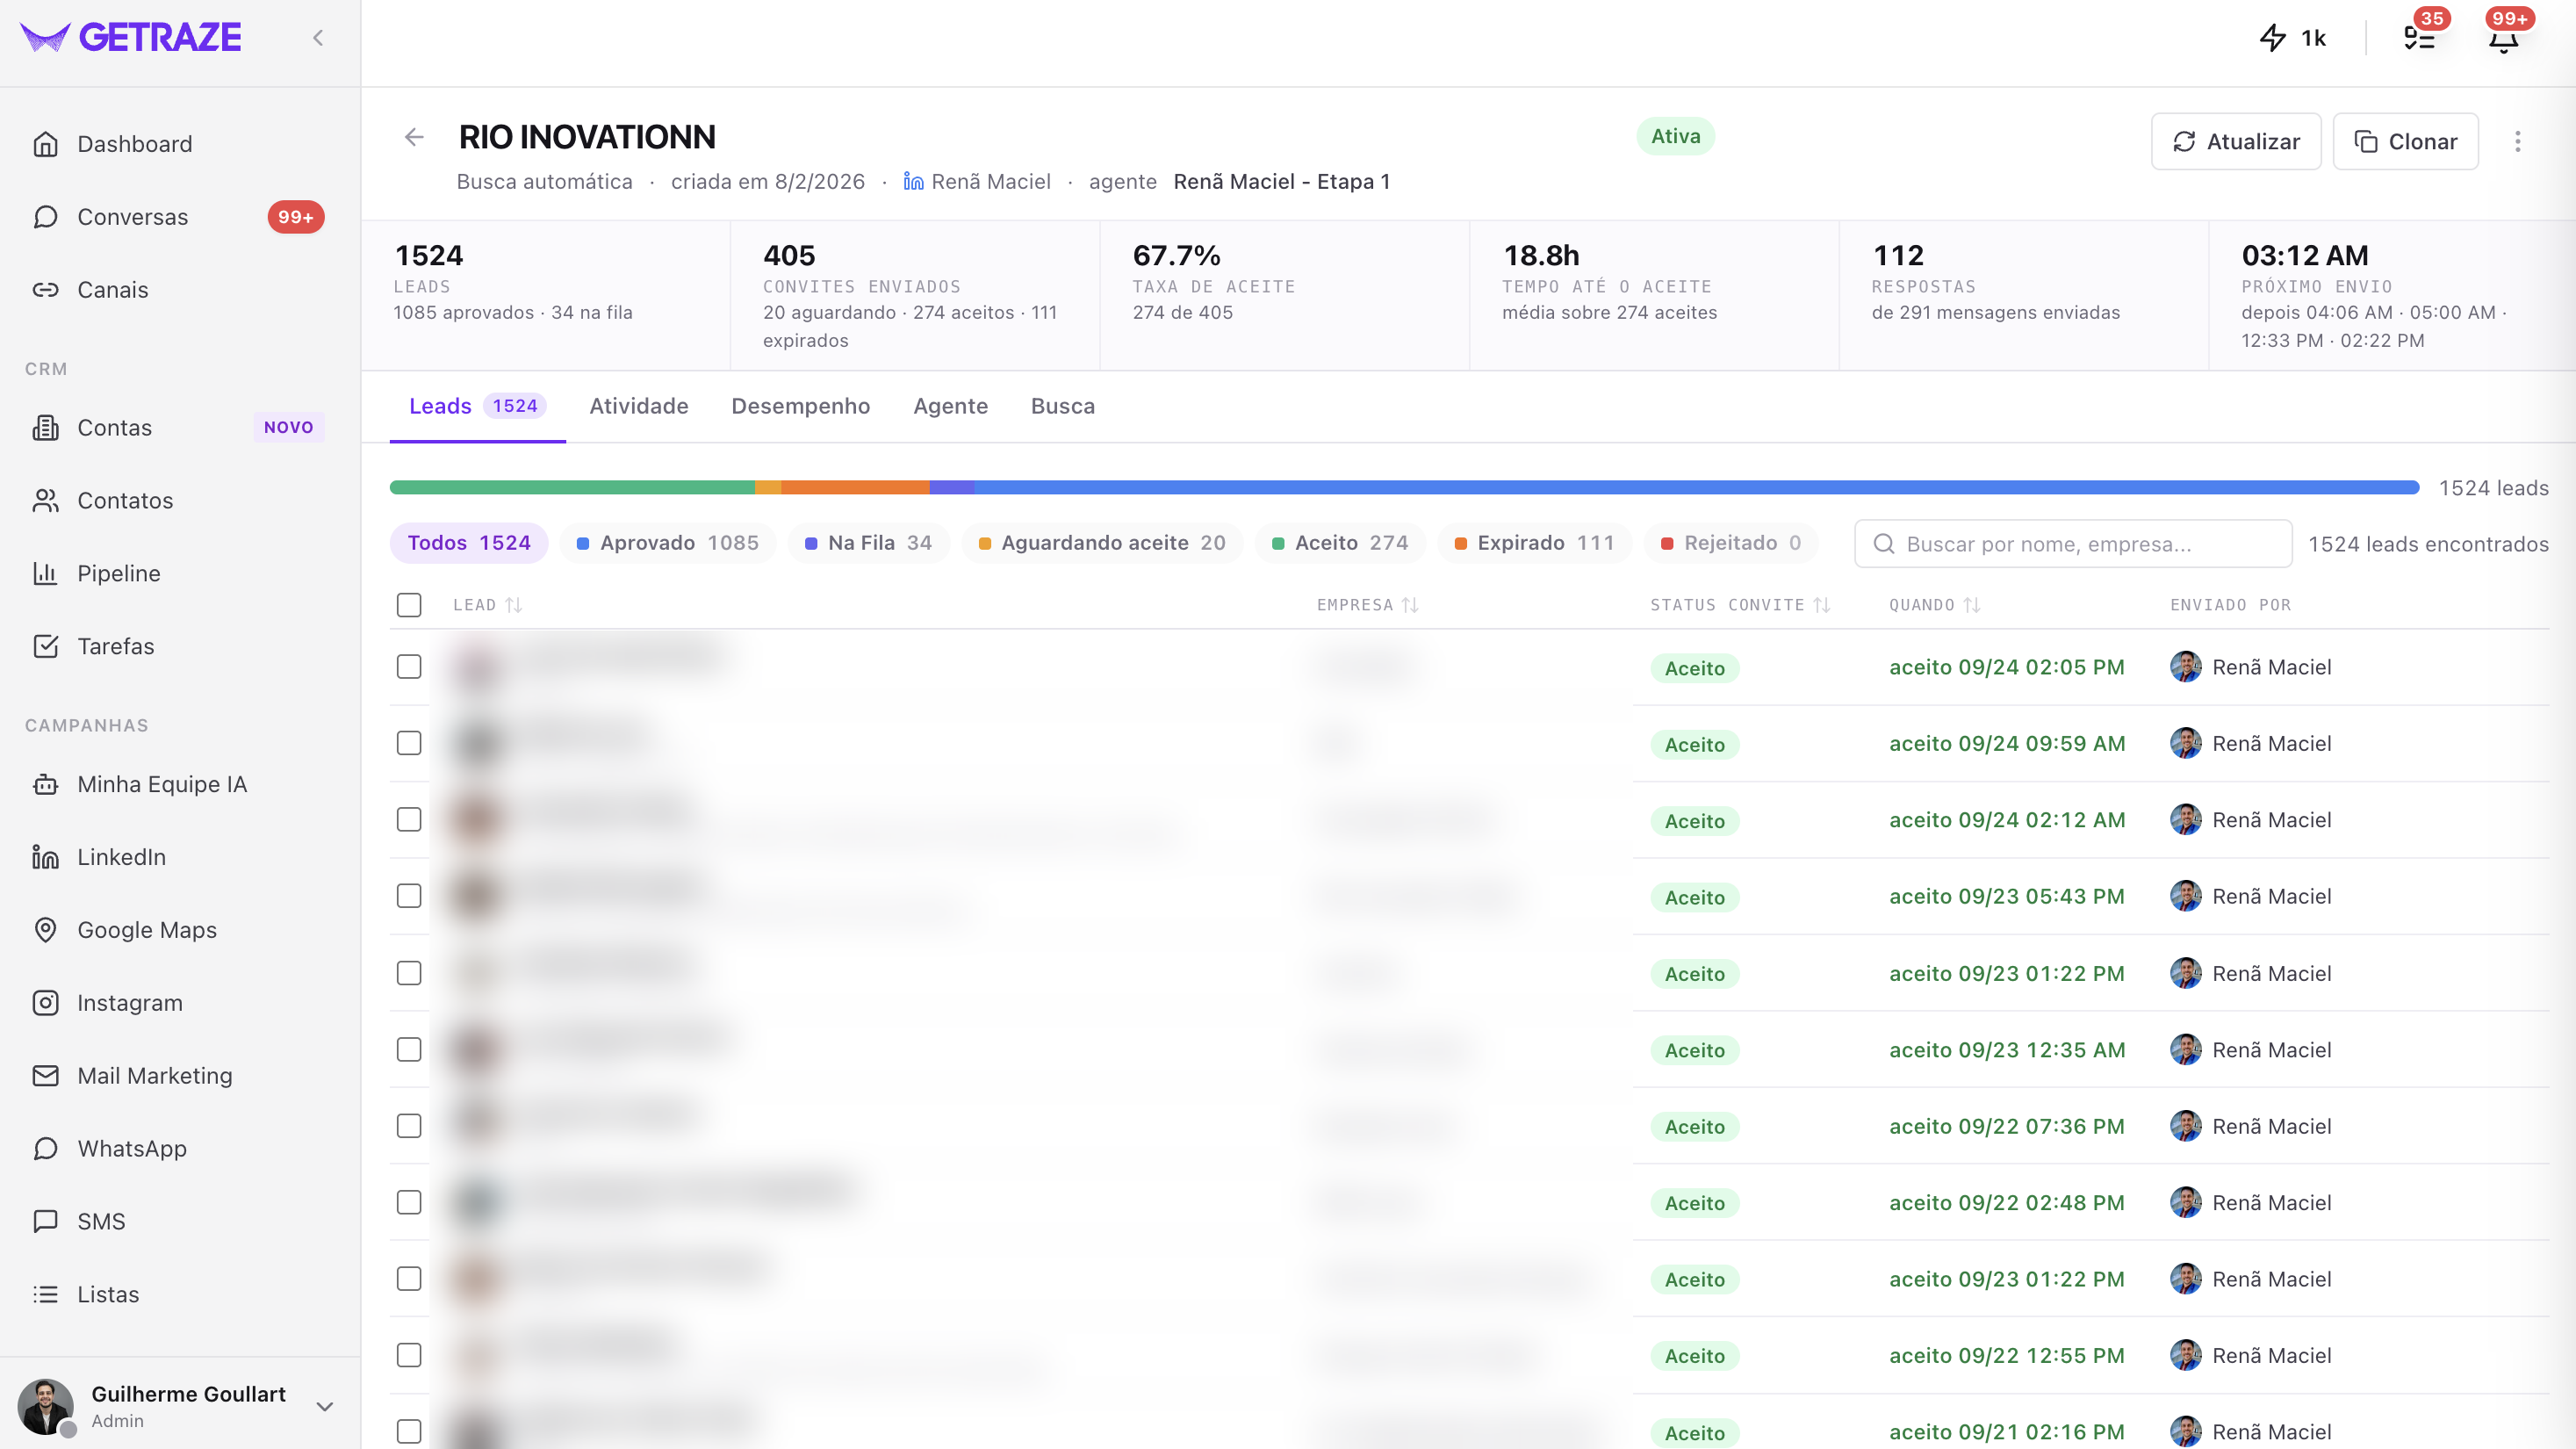
Click Report to open the full tracking view. The header holds the campaign name, the status badge and the context line: the contact source, the creation date, the owner and which agent is working.
On the right, Refresh reloads the numbers and Clone creates a copy of the campaign.
The numbers at the top
The indicator strip is the quick read of the campaign — and each number has the detail underneath:
| Indicator | What it shows |
|---|---|
| Leads | The campaign total, with how many are approved and how many are in queue |
| Invites sent | The total, with how many are awaiting, how many were accepted and how many expired |
| Acceptance rate | The percentage of invites that turned into connections, with the fraction behind it |
| Time to accept | The average hours between sending and acceptance, and how many acceptances it was calculated from |
| Replies | How many leads replied, out of how many messages were sent |
| Next send | The time of the next invite, followed by the next times in the queue |
Below the numbers are the five report tabs: Leads, Activity, Performance, Agent and Search.
Leads tab
It is the list of everyone in the campaign. At the top, a stacked bar shows the proportion between the situations, and right below it the status filters work as shortcuts — click one of them to see only that group:
All · Approved · In Queue · Awaiting acceptance · Accepted · Expired · Rejected
Each filter already shows its count, so you can read the health of the campaign without opening anything.
Next to it, the search by name or company finds a specific lead within the campaign.
The table lists, for each lead:
| Column | What it shows |
|---|---|
| Lead | The contact's name and job title |
| Company | Where they work |
| Invite Status | The current situation of the invite |
| When | The date and time of the most recent event — the acceptance, for example |
| Sent by | Which LinkedIn profile sent the invite |
💡 The Lead, Company, Invite Status and When columns are sortable — click the header to reverse the order. The checkboxes on the left let you select leads from the list.
Activity tab
The record of what happened in the campaign, event by event and in chronological order.
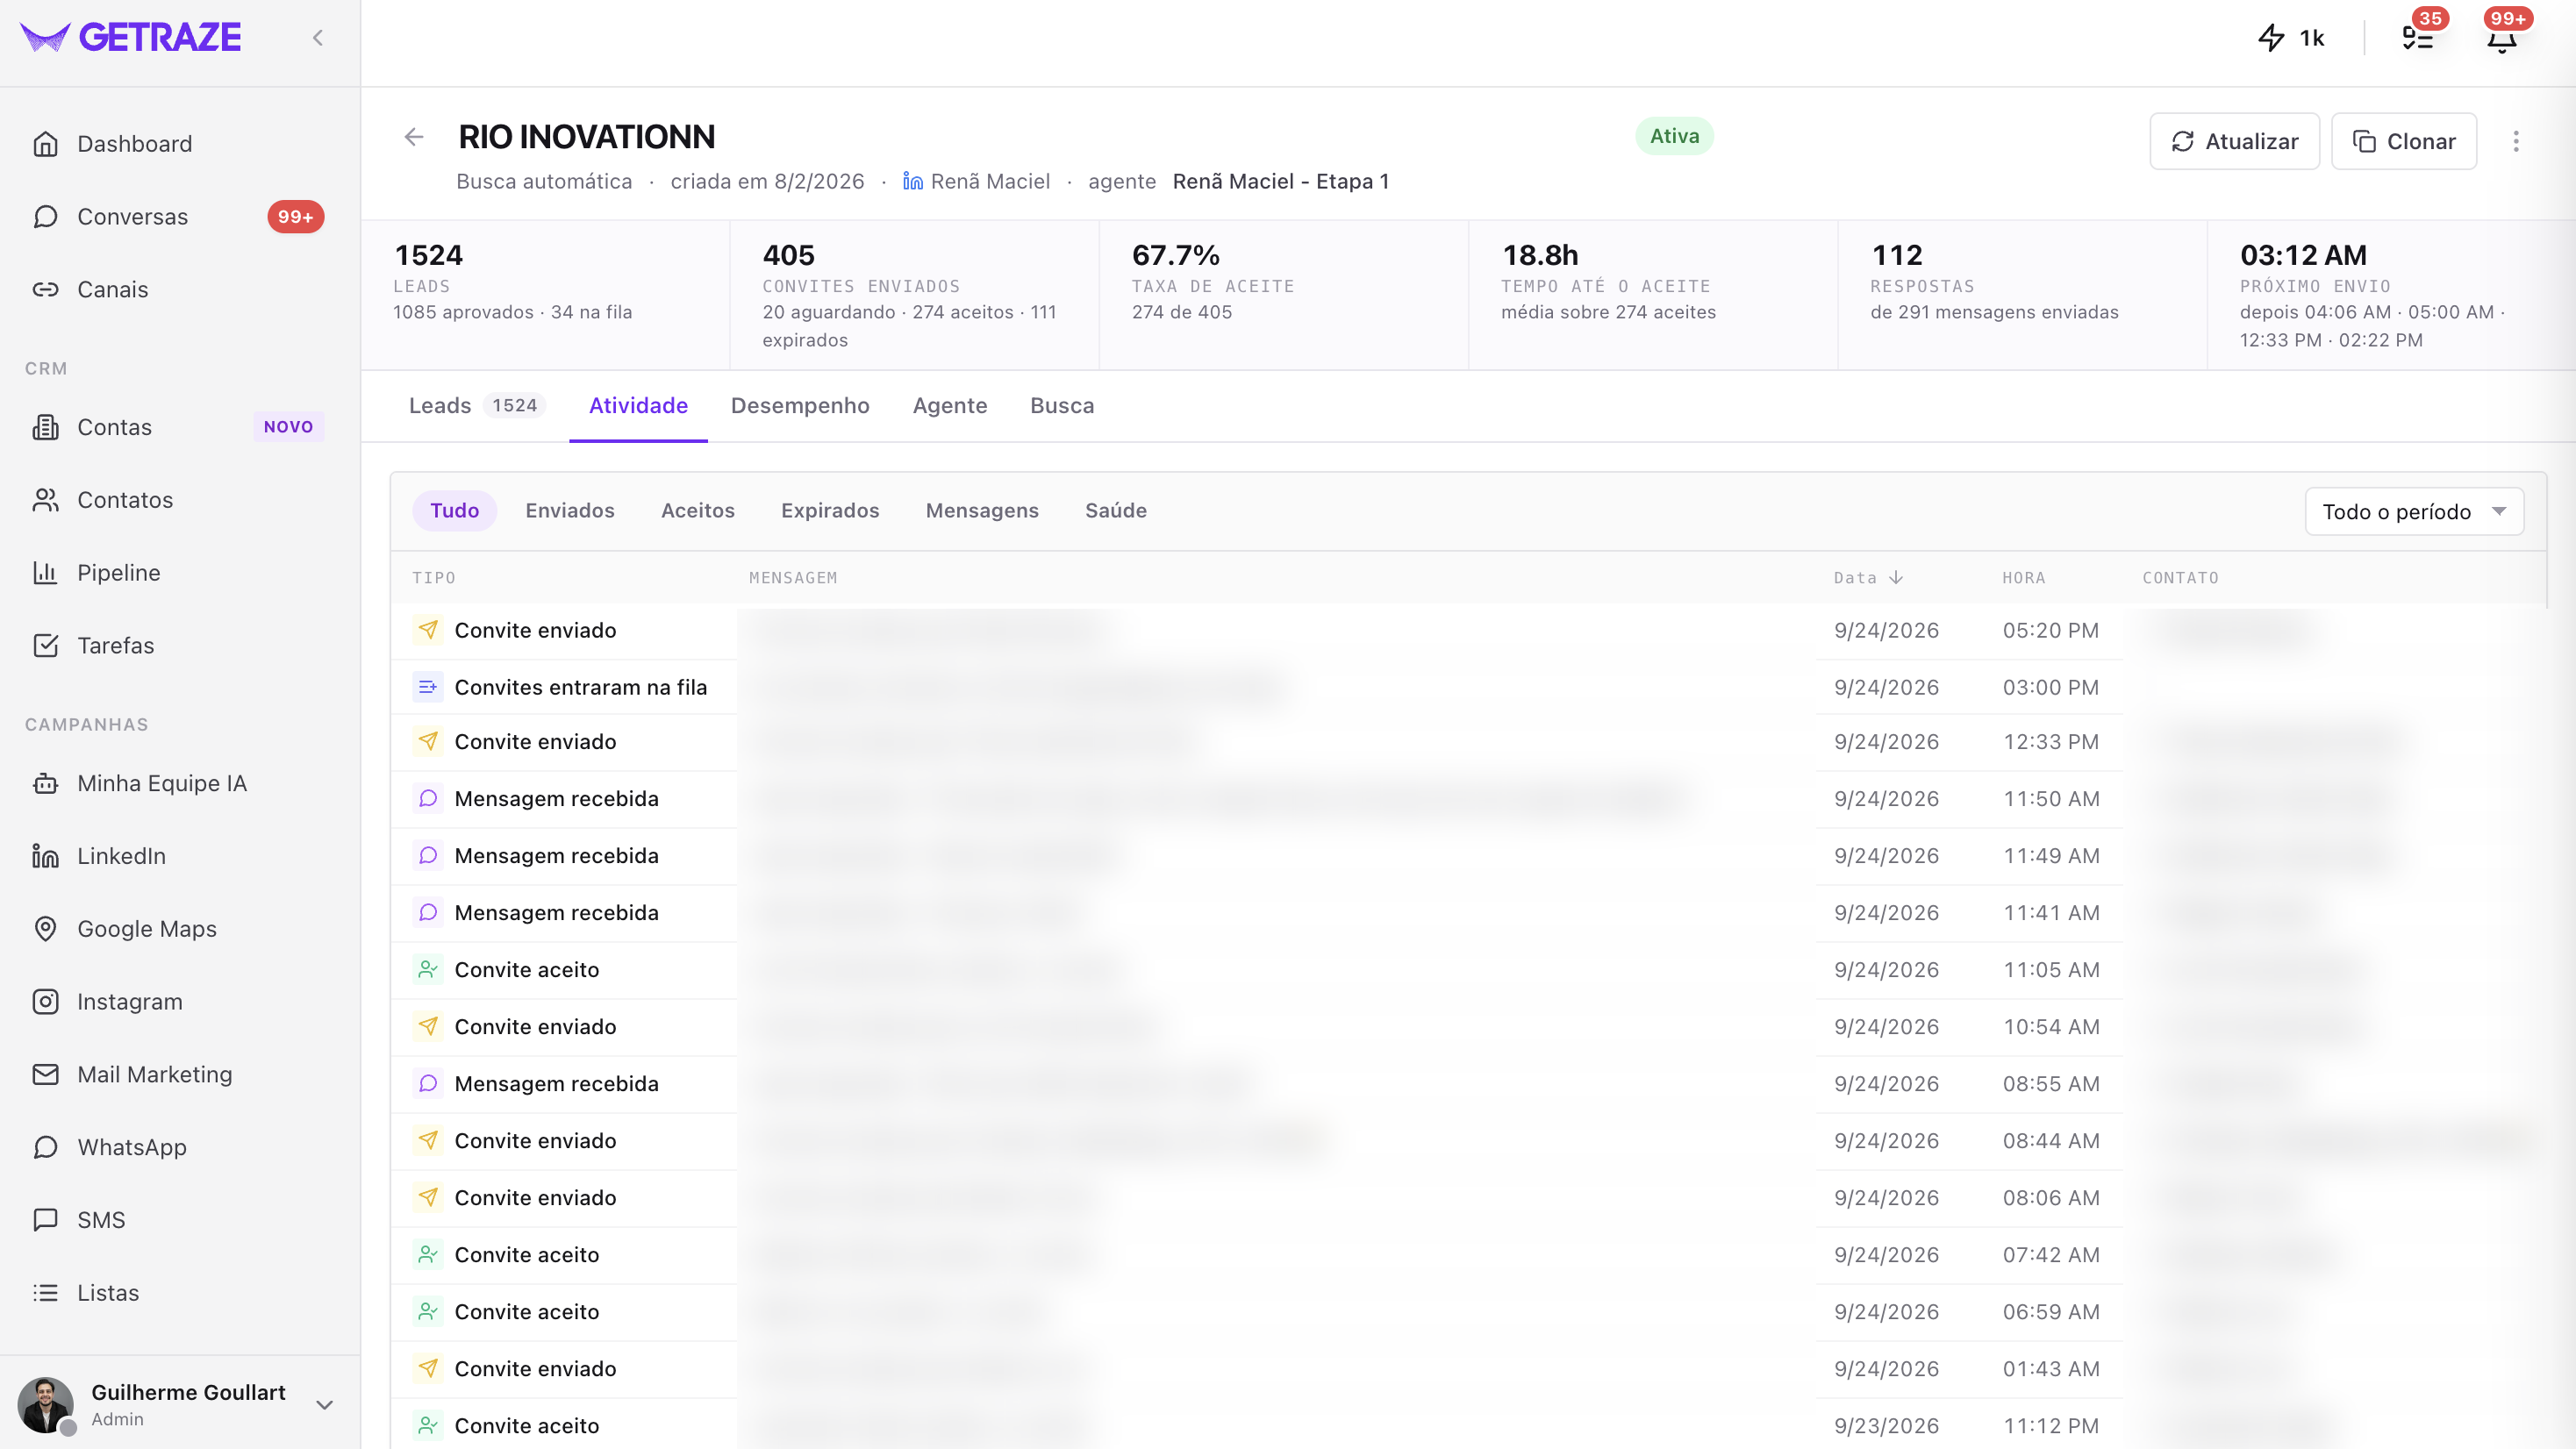
At the top you filter by type — All, Sent, Accepted, Expired, Messages and Health — and choose the period in the selector on the right.
The table shows the event type, the message that describes it, date, time and the contact involved. Among the events that show up here:
- Invite sent — to whom and when;
- Invites queued — how many were scheduled at once;
- Invite accepted — who accepted;
- Message received — with an excerpt of what the lead replied.
💡 It is the tab for answering "what happened with this person?" — and the Messages filter isolates just the replies, which is usually where the interesting stuff is.
Performance tab
This is where the campaign turns into analysis, in four panels.
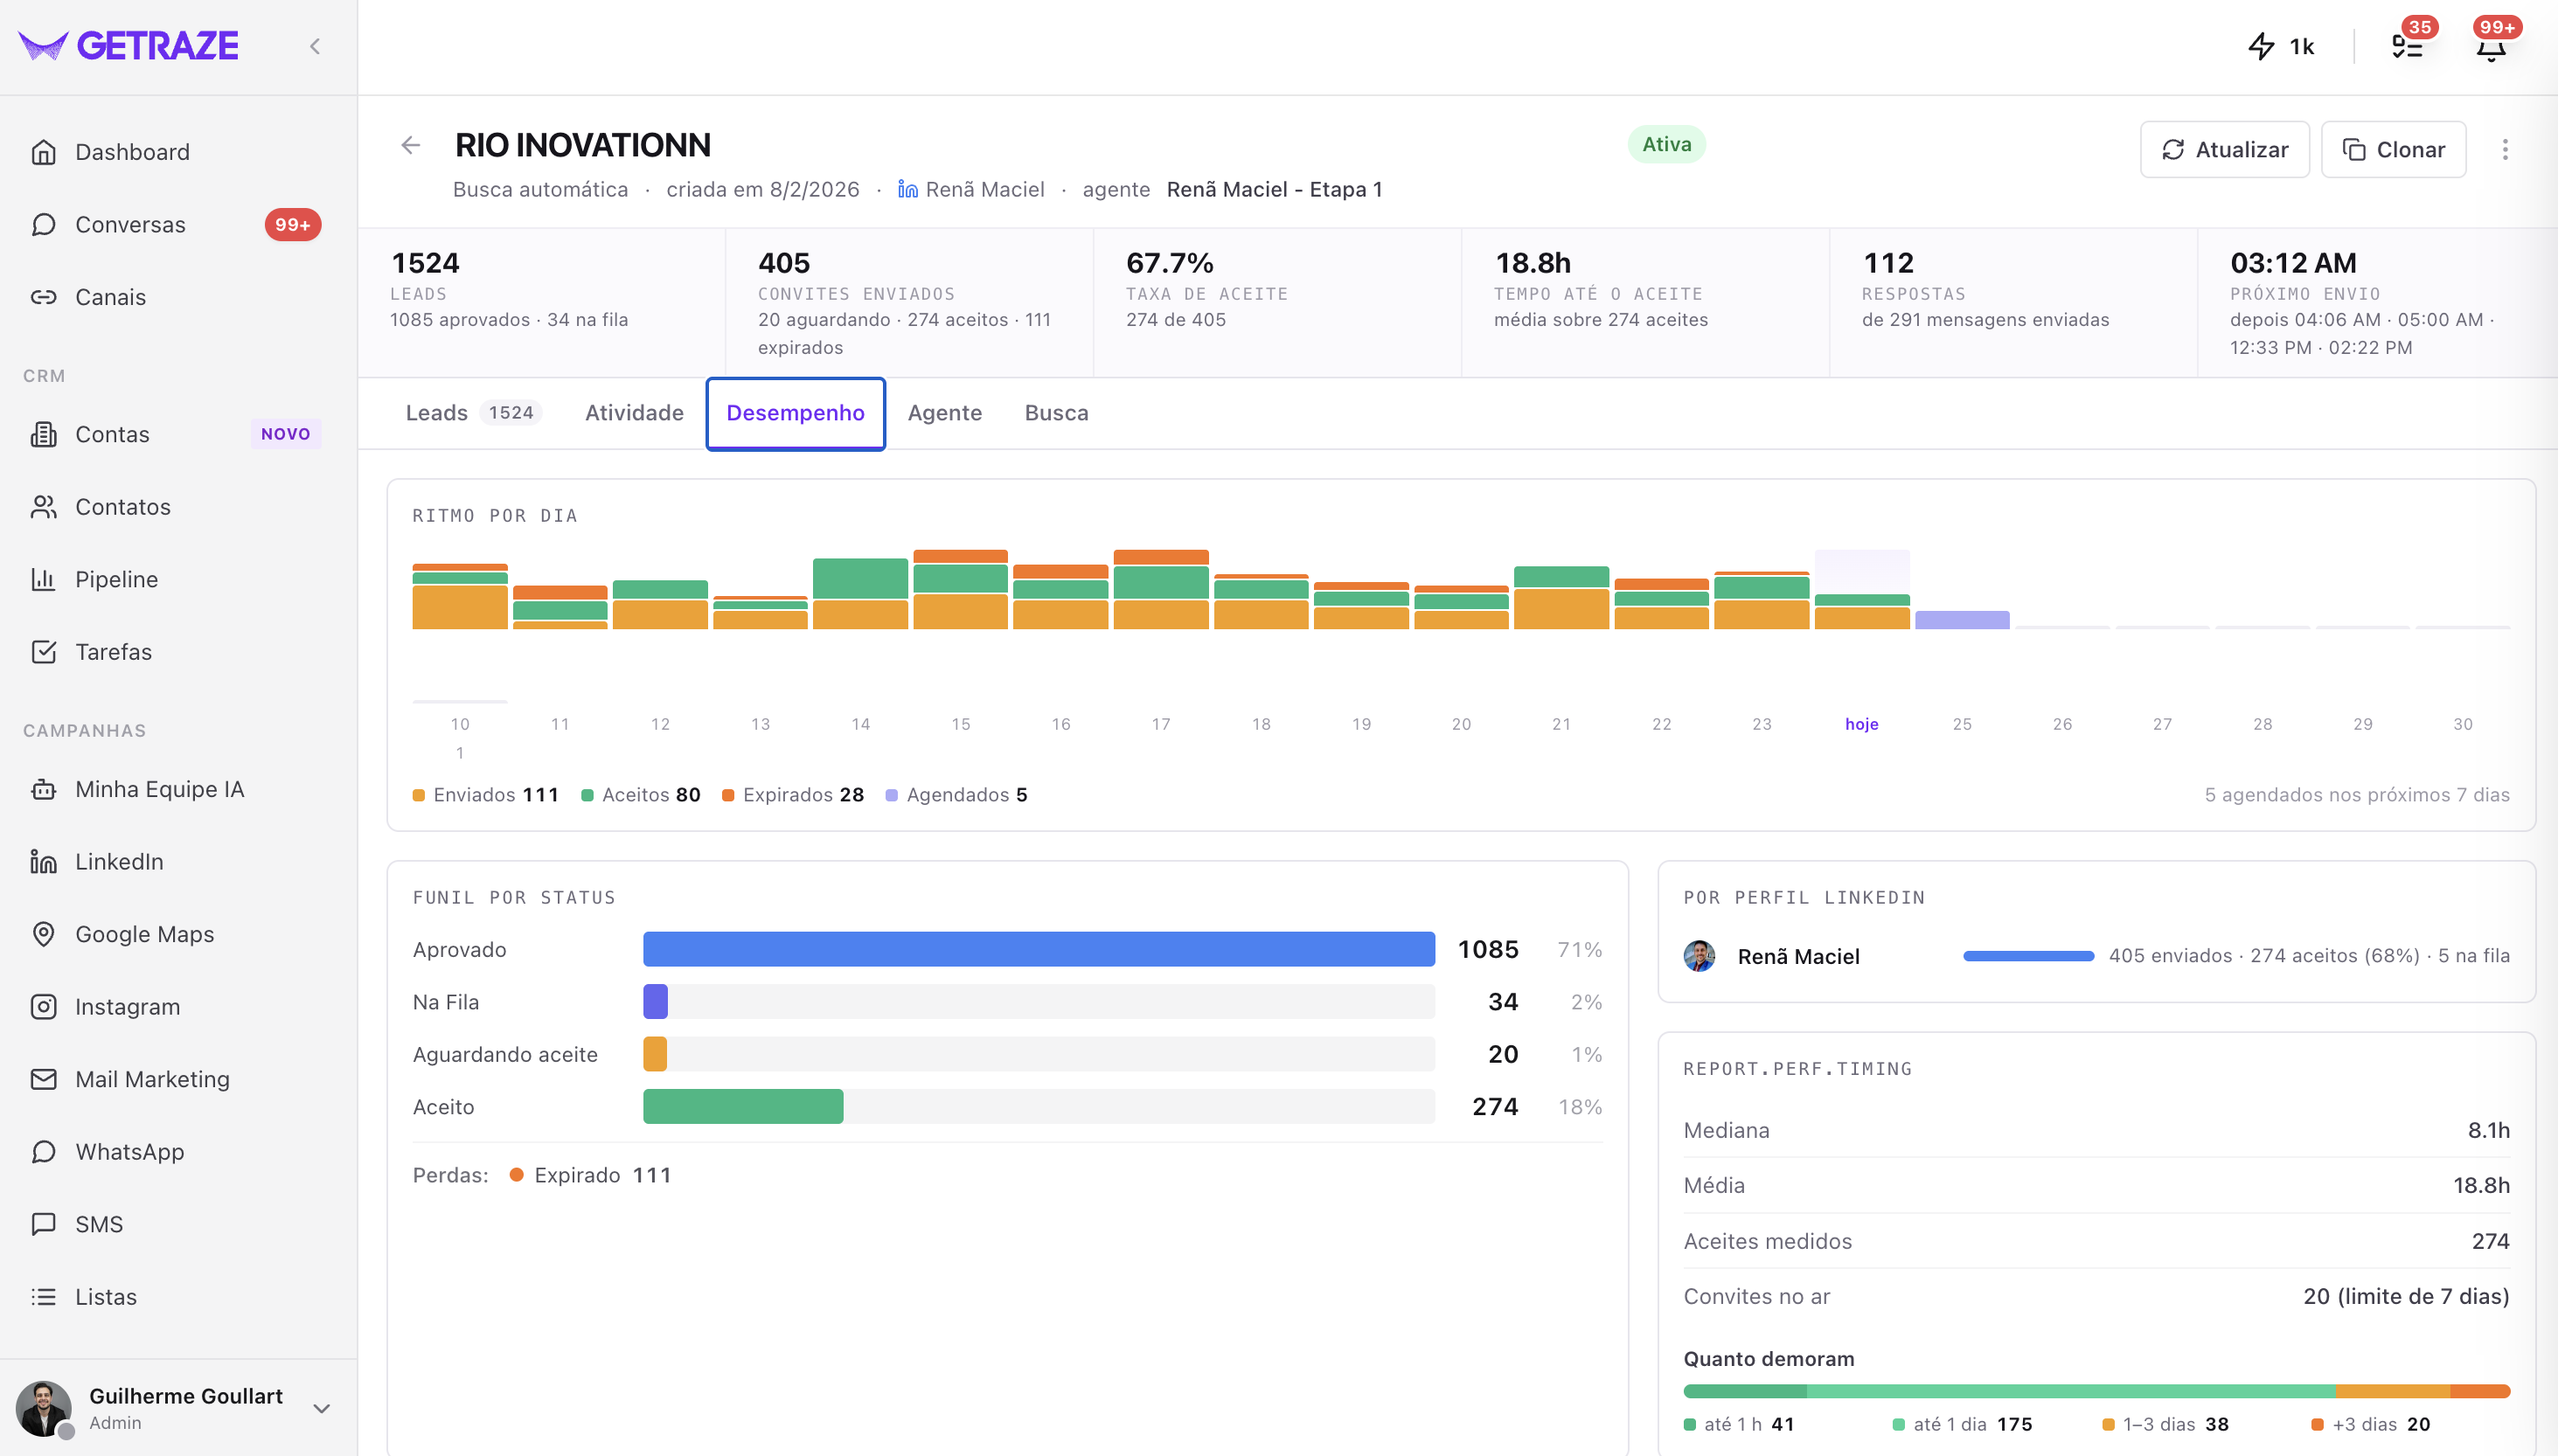
Daily rhythm
A bar chart by day, stacking Sent, Accepted, Expired and Scheduled. Today is marked, and on the right the platform shows how many invites are scheduled for the next 7 days — in other words, the chart shows the campaign's past and immediate future on the same timeline.
Status funnel
Horizontal bars with the number and percentage of each situation: Approved, In Queue, Awaiting acceptance and Accepted. Underneath, separately, are the losses — the expired invites.
By LinkedIn profile
How the work is split among the accounts running the campaign. For each profile: how many invites were sent, how many were accepted (with the percentage) and how many are in queue.
💡 In campaigns with more than one profile, this is where you see whether one of them is dragging the result down — very different rates between accounts usually point to a problem with one of them, not with the audience.
Time to accept
The panel that explains the campaign's speed:
- Median and average time between sending and acceptance — when the two are far apart, a few very slow acceptances are pulling the average up;
- Acceptances measured — the calculation base;
- Invites pending — how many are still pending, and the limit in days before they expire;
- How long they took — the distribution of acceptances in ranges: up to 1 hour, up to 1 day, 1 to 3 days and more than 3 days.
Agent tab
Shows which agent is running in the campaign and, below, its flow drawn step by step.
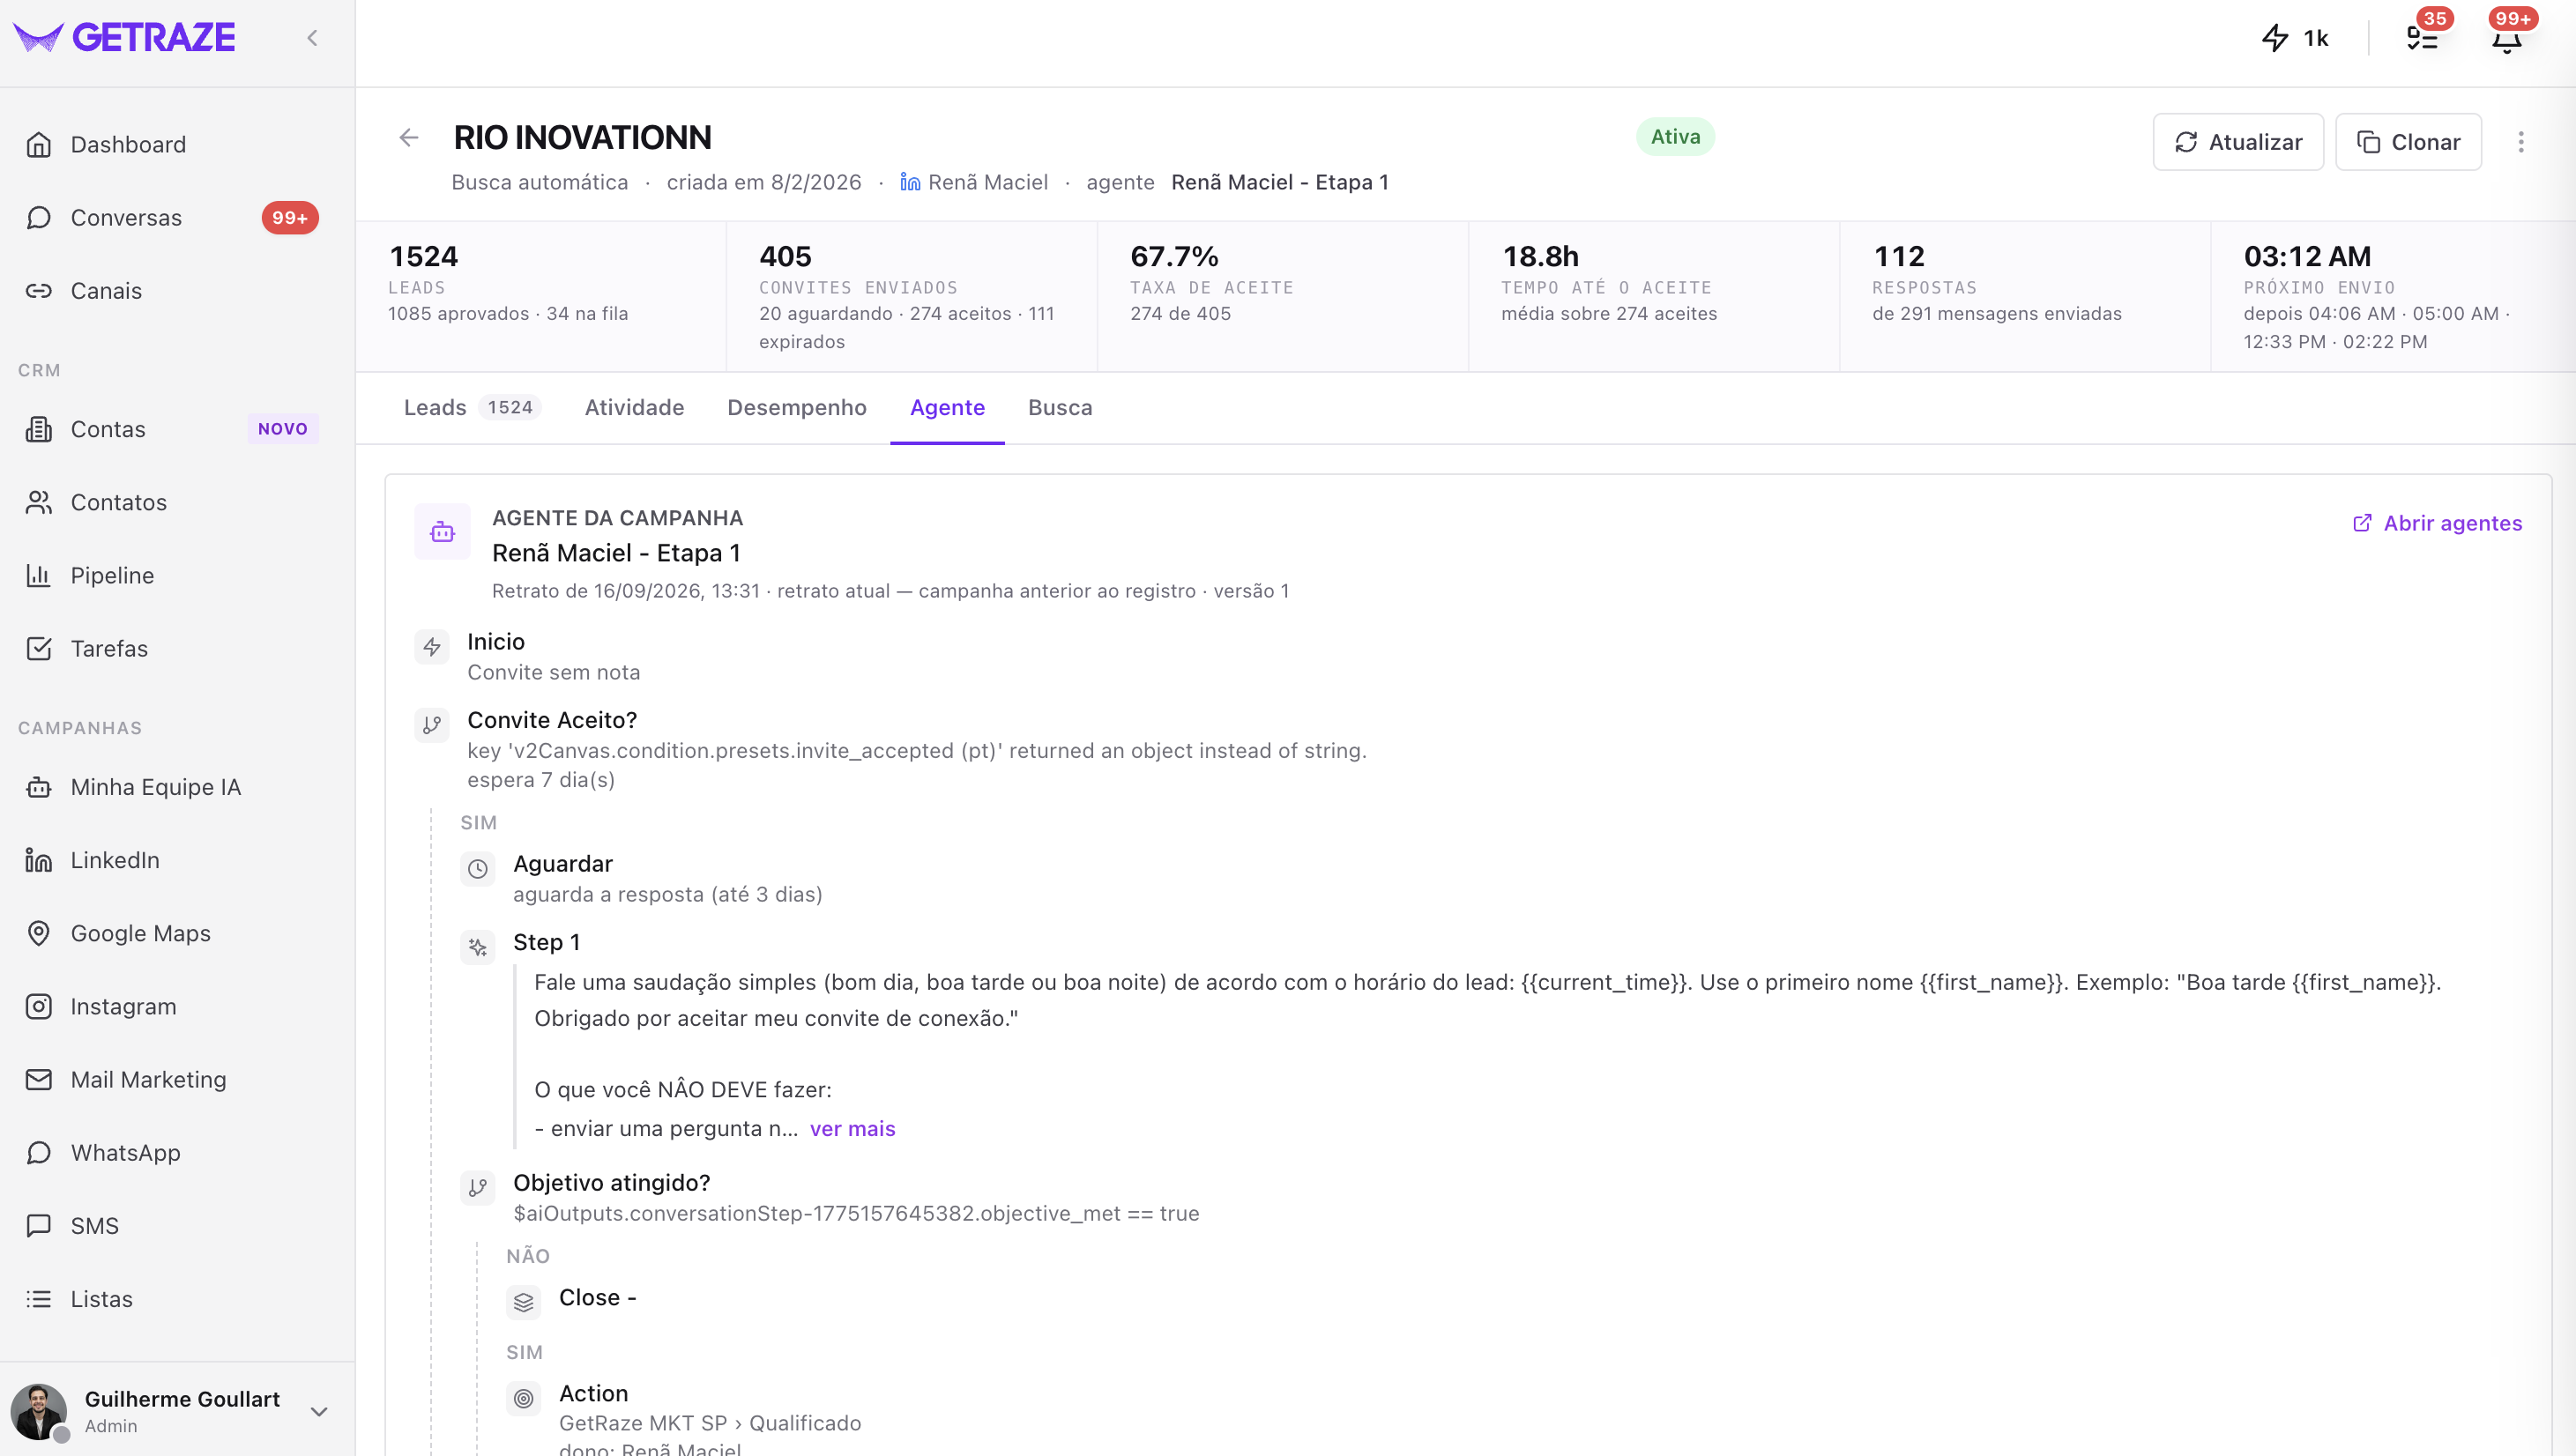
At the top are the agent name, the snapshot date and the version — it is a snapshot of the configuration, not the editing screen. The Open agents link takes you to where the agent is actually edited.
The flow appears as a tree, in the order the agent runs it:
- Start — how the campaign approaches (for example, invite without a note);
- Conditions — such as Invite accepted?, with the waiting period;
- Waits — how long the agent waits for a reply before moving on;
- Steps — the text of the instructions the agent receives at each stage;
- Actions — what happens when the goal is reached, such as moving the lead to a pipeline and stage with a defined owner.
💡 It is the tab for checking, without leaving the report, whether the agent handling the campaign is the one you expect — and what exactly it was instructed to do.
Search tab
Shows which filters originated the campaign — job titles, keywords, industries and location. It helps you remember exactly which audience is being worked, especially in old campaigns or ones created by someone else on the team.
Next steps
- Create new campaigns to feed the funnel — see LinkedIn campaign types;
- Keep an eye on the acceptance rate: it shows whether your audience and your approach are well calibrated;
- Use several profiles in higher-volume campaigns and check in Performance → By LinkedIn profile whether they are all performing equally.